Annual Disability Status Reports
Download national and state-level reports presenting prevalence and relative economic status of people with disabilities.
Easily create and save maps, charts, and tables of national, state, and local disability statistics
Go To Stats!
Download national and state-level reports presenting prevalence and relative economic status of people with disabilities.
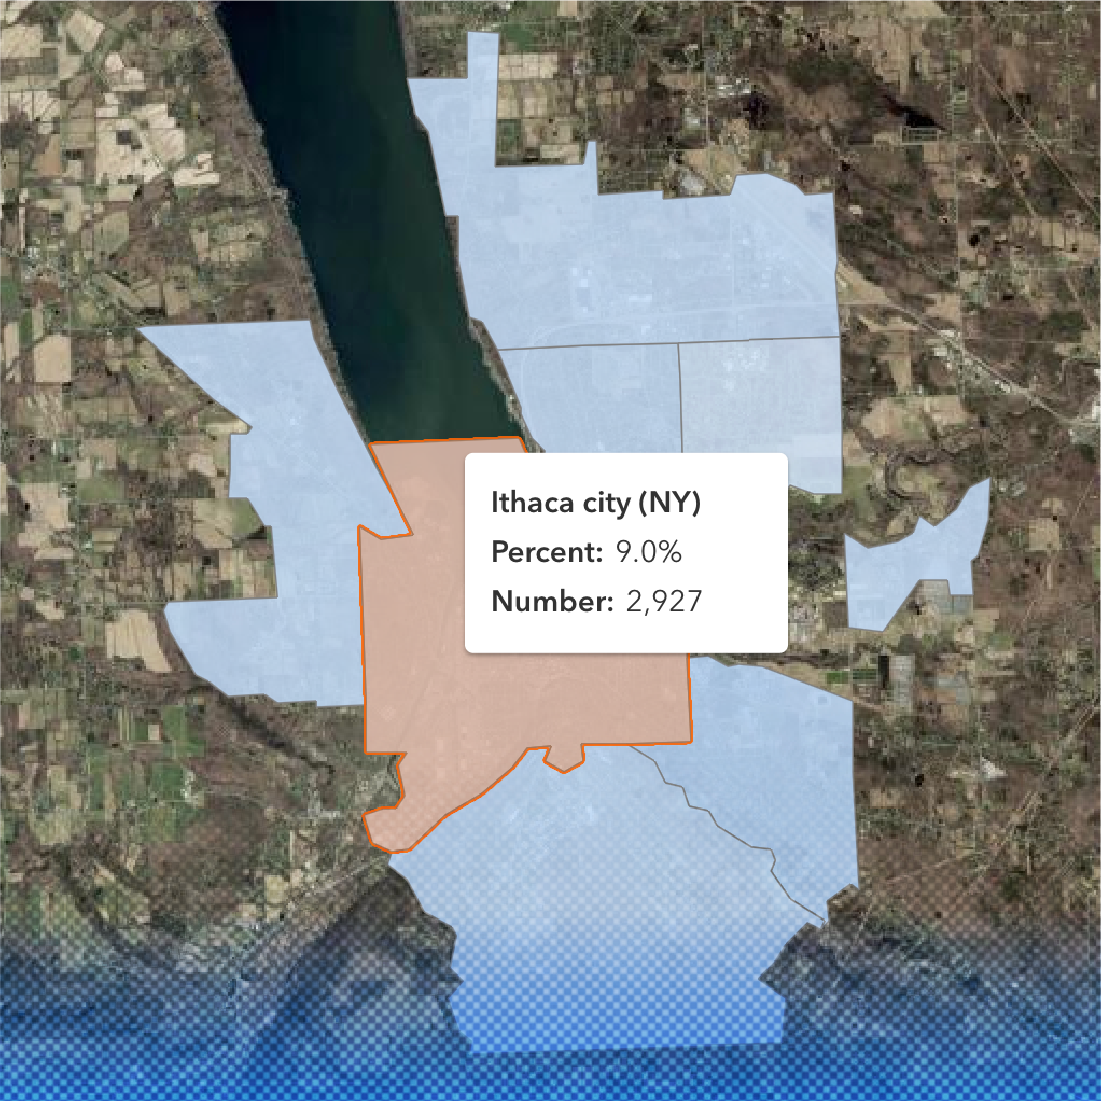
We’ve expanded our geography options! In addition to national and state-level estimates, you can now get estimates for over 30,000 census places.
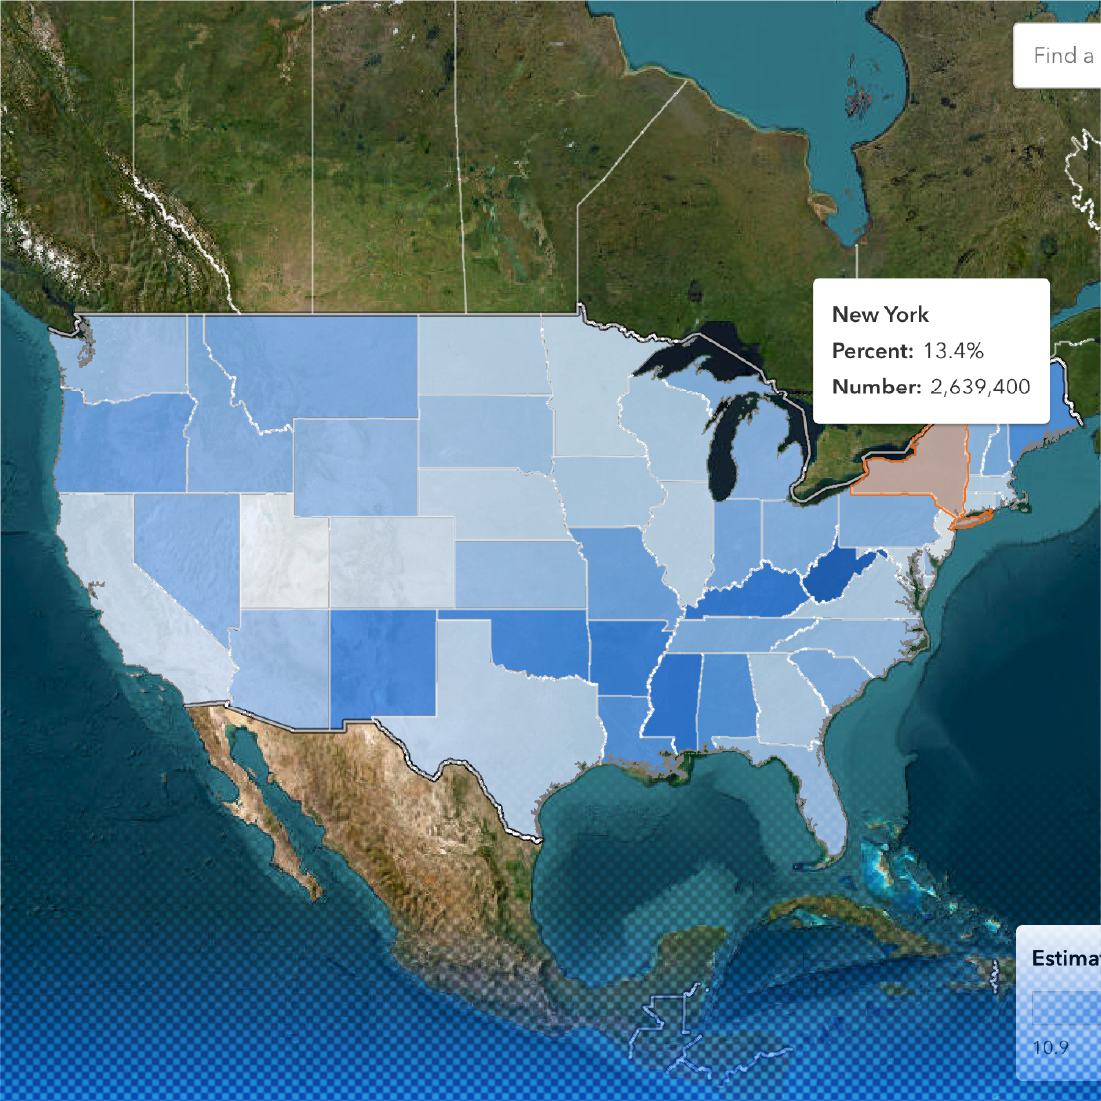
We've upgraded our mapping software to arcGIS! This provides more mapping features and detailed data.
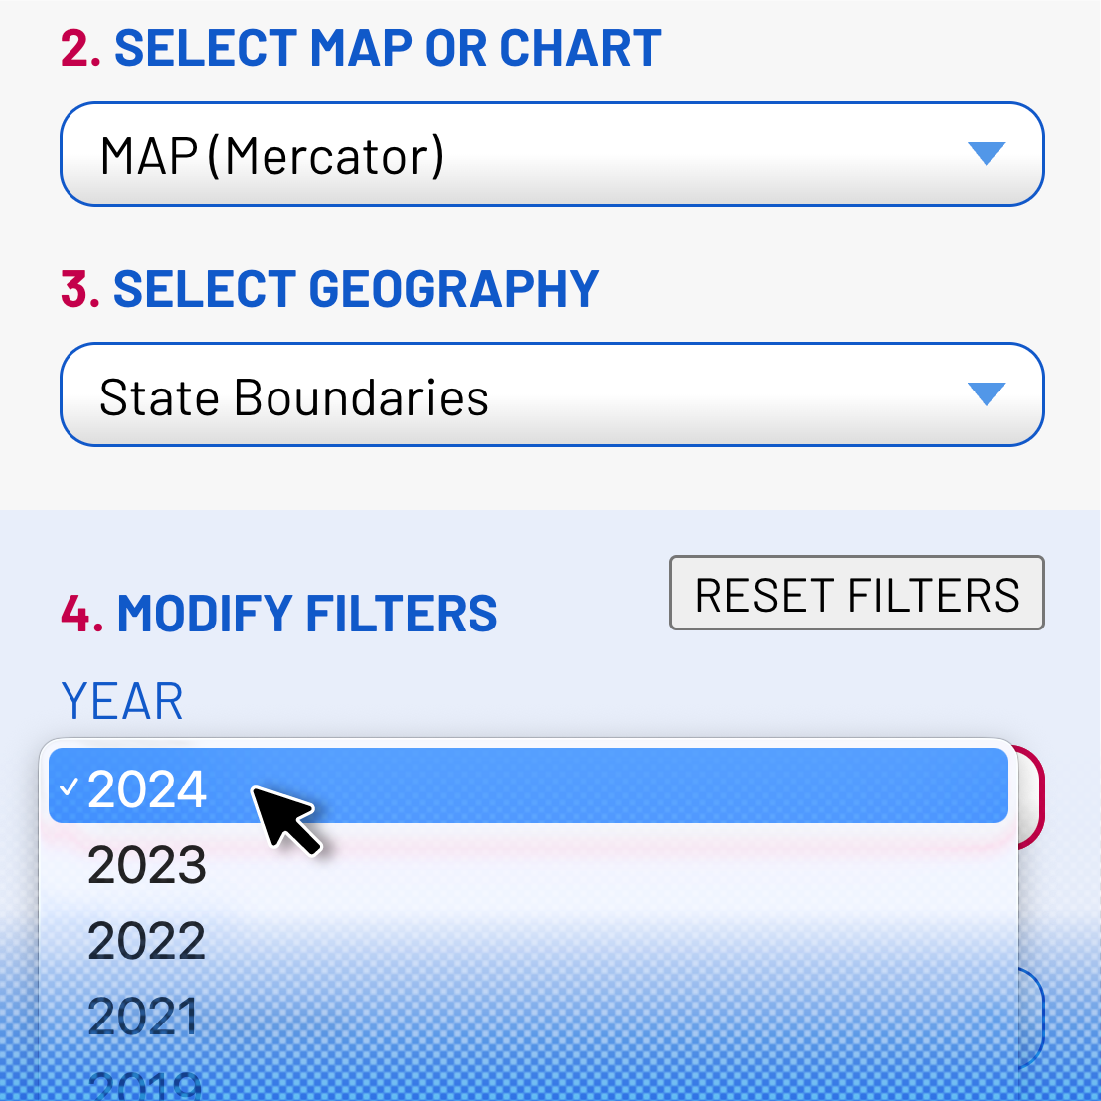
Get the most recent data for your area! We’ve updated our data to include the most recent 2024 ACS data.
View and download maps, charts, tables, and summaries
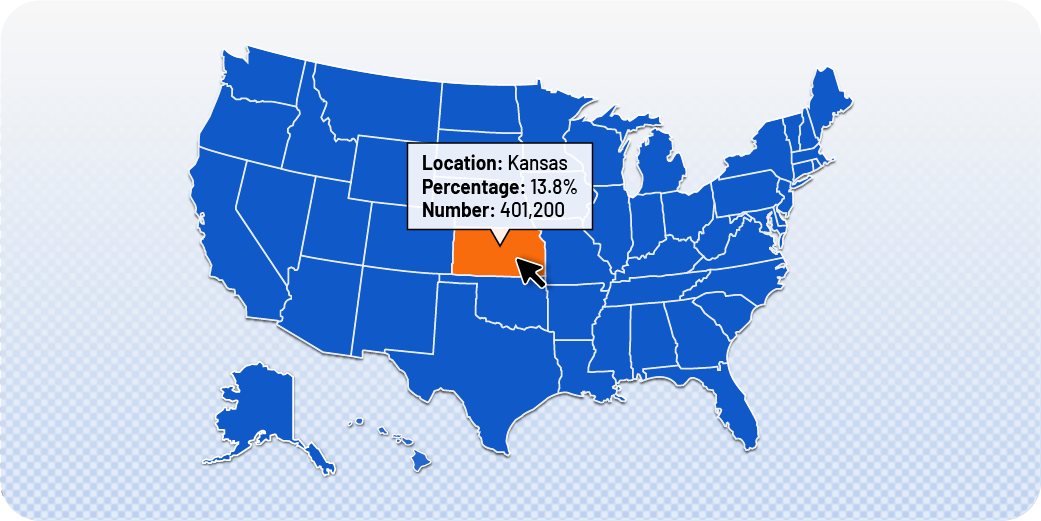
Display disability statistics by county, congressional district, or state. Pan, zoom, and view details on demand. Filter by form or histogram to specify the data you need.
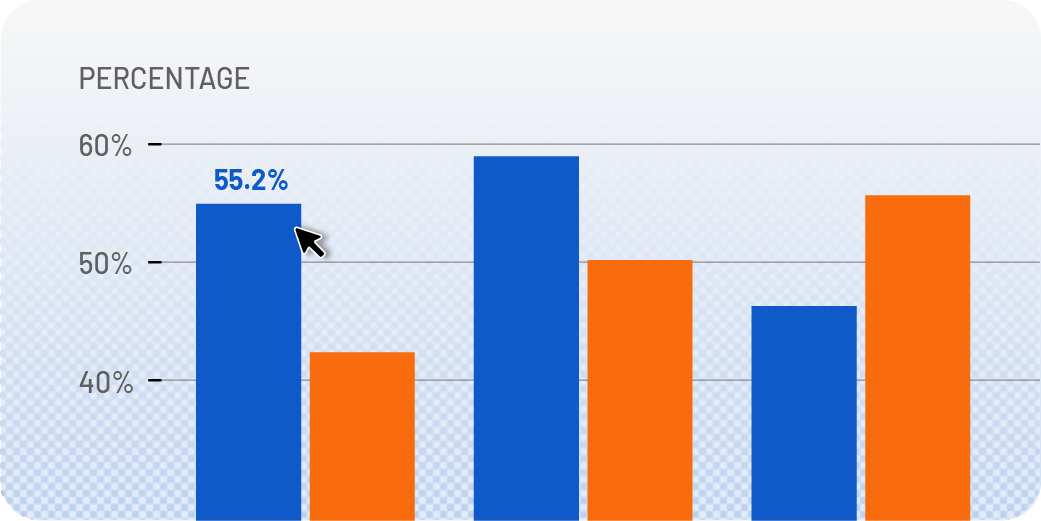
Customize charts to view statistics by disability type, race, sex, or education for selected counties, congressional districts, or states.
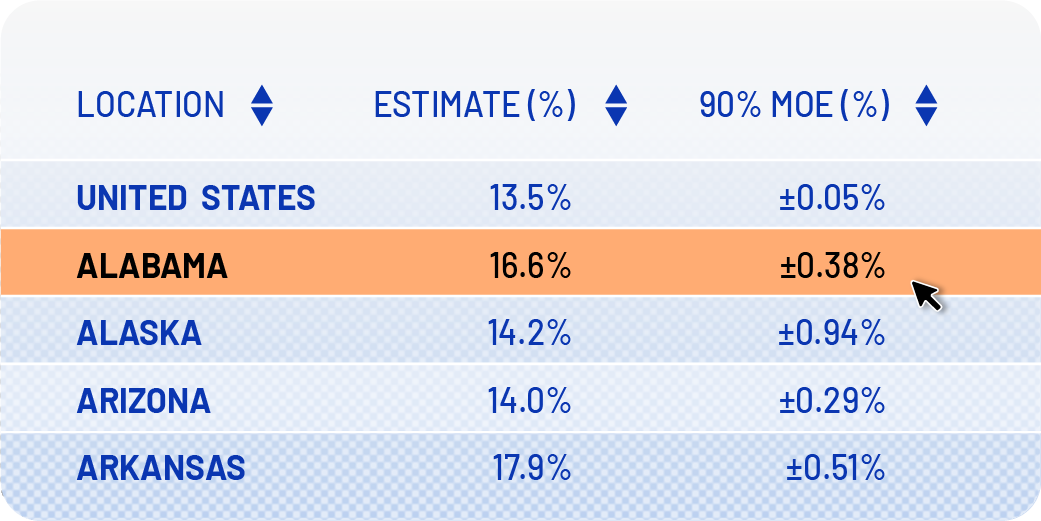
All map and chart data are available in accessible tabular format. Sort and customize column views to get the table you need.
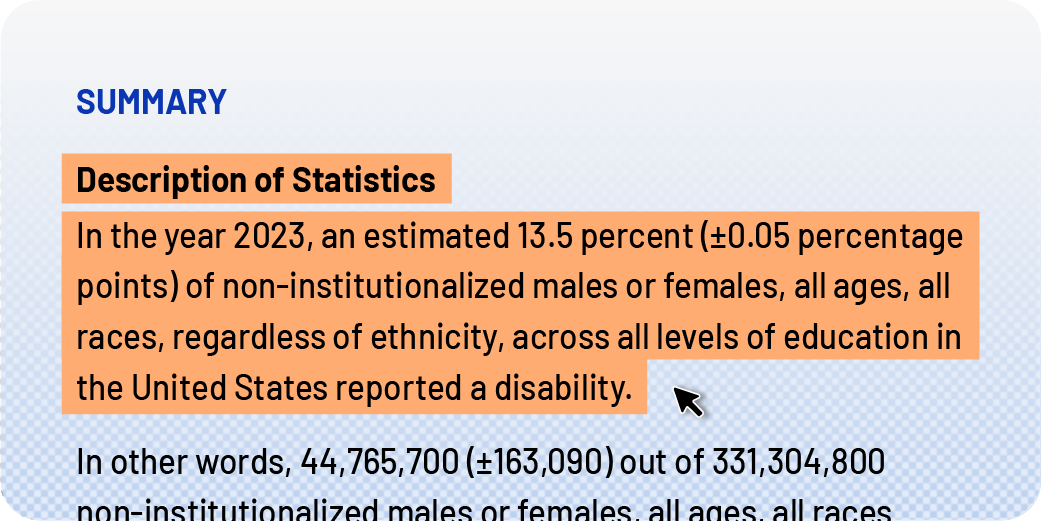
Need help writing about the statistics you’ve selected? Select and copy descriptive text for your reports and grants!
American Community Survey (ACS)

DisabilityStatistics.org provides two sets of estimates from the U.S. Census Bureau's American Community Survey (ACS): ACS Custom 1-Year Estimates and ACS Census 5-Year Estimates.
ACS Custom 1-Year Estimates are generated by the Yang-Tan Institute on Employment and Disability at Cornell University using the 1-year ACS Public Use Microdata Sample (PUMS) data.
ACS Census 5-Year Estimates are based on estimates from tables generated by the Census Bureau. These estimates are based on data compiled over a 5-year period, that is, the 2024 5-year Estimates use data collected from 2020 to 2024.

Bill Erickson is our Senior Researcher and he is here to answer your questions about disability statistics!
Create an account or sign in to ask Bill your question.
Sign InDon't have an account? Create an account
DisabilityStatistics.org is a free source of disability-related statistics and estimates. You can use DisabilityStatistics.org to shape policy, make decisions, or request funding so that people with disabilities are more fully included in the workplace and community. Researchers and others who want to go beyond the data available here can use our Dataset Directory and Disability Data Source User Guides.
For more about the 2025 relaunch of this website, read DisabilityStatistics.org Offers Visualization and Local Data and Bill Erickson Has a Spreadsheet with 3.2 Million Rows.
DisabilityStatistics.org is published by the Northeast ADA Center, which is one of ten regional ADA Centers in the United States. The goal of the Northeast ADA Center is to educate and empower all ADA stakeholders throughout New York, New Jersey, Puerto Rico, and the US Virgin Islands to increase their knowledge of the ADA and to support them to include people with disabilities in local communities and to implement the ADA in their own lives, workplaces, businesses, and communities.
The Northeast ADA Center is housed in the Yang-Tan Institute on Employment and Disability, which is part of the Cornell University ILR School. The Yang-Tan Institute works toward a world where people with disabilities are fully included in the workplace and community by advancing knowledge, policies, and practice that enhance equal opportunities for all people with disabilities.
There is no single, universally accepted definition of disability. In fact, 73 US federal acts or programs that define disability are noted in “Federal Statutory Definitions of Disability,” a report from the Interagency Committee on Disability Research.[1]
The most frequently applied framework of disability comes from Saad Nagi.[2] This conceptualization views disability as difficulty performing socially expected activities, such as work for pay, and explicitly recognizes how the environment and pathologies/impairments interact to cause disabilities. The Americans with Disabilities Act (ADA) rests on the Nagi framework and recognizes that improvements in the environment (access to public transportation, workplace accommodations, and so on) can reduce disability and thus improve the inclusion of all people.
In Nagi’s framework, the dynamic nature of the disability process is represented by four stages: pathology, impairment, functional limitation, and disability:
The connections between stages in this process are not inevitable, and they are related to personal characteristics and physical and social environmental factors. These factors can be addressed via access to vocational rehabilitation services, universal design, assistive technology, personal assistance services, and so on. For example, a person with a severe hearing impairment can be accommodated in the workplace with Assistive Listening Devices (ALDs), sign language interpreters, or captioning, such that there is no functional limitation or subsequent work disability.
The World Health Organization’s International Classification of Functioning, Disability and Health is conceptually similar to the Nagi framework. Both approaches recognize that individuals move from the presence of a health condition to a point at which the condition impinges on activities that are socially expected of them, and this movement relates to the environment where they live.
Measuring the disability process with surveys and administrative records is challenging. The six ACS disability questions were revised in 2008 from those initially used in the Decennial Census 2000 (see Disability and Disability Types – Census 2000). Since that time, the six ACS disability questions have been adopted for use by several federal surveys. These include the Survey of Income and Program Participation (SIPP), American Housing Survey (AHS), American Time Use Survey (ATUS), and Current Population Survey (CPS) from the Bureau of Labor Statistics.
The six ACS disability questions have also been integrated into several health-focused surveys, including the Behavioral Risk Factor Surveillance System (BRFSS) from the Centers for Disease Control (CDC), Medical Expenditure Panel Survey (MEPS), National Health and Nutrition Examination Survey (NHANES), National Survey of Children’s Health (NSCH), National Health and Aging Trends Study (NHATS), National Health Interview Survey (NHIS), and ATUS.
Note: The wording of the ACS disability questions is slightly altered in some non-ACS surveys. Even seemingly minor wording changes can impact how people respond, as does the context in which the questions are presented.
Many existing data sources are being collected using a variety of disability measures, which can be associated with various stages in the Nagi framework.
Another disability measure relates to work limitation (see What is a CPS Work Limitation Disability?). Although worded differently between surveys, questions about work limitation appear in the Decennial Census 2000, ACS (2000–2007), CPS, NHIS, MEPS, Panel Study of Income Dynamics (PSID), SIPP, and Health and Retirement Survey (HRS).
Questions about other activity limitations appear in all these surveys as well. Questions relating to limitations in fundamental activities and broad questions about impairment appear in the Decennial Census 2000 and HRS, as well as in all surveys using the six ACS disability questions. Questions about select sets of specific health conditions and impairments appear in the SIPP, SIPP SSA Supplement, NHIS, MEPS, BRFSS, and HRS.
More Info: For more disability data sources and information, visit the Rehabilitation Dataset Directory.
References:
[1] Interagency Committee on Disability Research. (2024). Federal Statutory Definitions of Disability.
[2] Nagi, S. Z. (1969). Disability and Rehabilitation. Ohio State University Press.
The annual Disability Status Reports summarize the most recent demographic and economic statistics on the non-institutionalized US population with disabilities at the state and national level. They are aimed at policymakers, disability advocates, and reporters. The reports contain information on population size and disability prevalence for various demographic subpopulations, as well as statistics related to employment, earnings, and household income. Comparisons are made to people without disabilities and across disability types.
Annual Disability Status Reports are available for each US state, the District of Columbia, and Puerto Rico. This site also provides a report for the US Virgin Islands every ten years, with reports from 2010 and 2020 currently available.
The reports focus primarily on the working-age population because the employment gap between people with and without disabilities is a major focus of government programs and advocacy efforts. Further, employment is a key factor in the social integration and economic self-sufficiency of working-age people with disabilities. In the future, we will add health-related statistics.
The estimates in the Disability Status Reports are based on analysis of the US Census Bureau’s American Community Survey (ACS) Public Use Microdata Sample (PUMS). For additional disability-focused information in the ACS, see A Guide to Disability Statistics from the American Community Survey (2008 Forward).
There are several reasons for differences in reported numbers or percentages of people with disabilities. These include different definitions of disability, changes in the disability questions used over time, different data sources, the time period an estimate is based on, different age groups, and different base populations, such as civilians only, non-institutionalized population, household population, and so on. There can also be differences in how people respond to questions depending on the context they are presented in.
More info:
The Custom 1-Year Estimates are based on a single year of ACS Public Use Microdata Sample (PUMS) data, while the Census 5-Year Estimates displayed are based on ACS data compiled across 5 years (i.e., the 5-year 2023 estimates use 2019–2023 data). The single-year ACS PUMS data allows us to develop state and national estimates for the topics and combinations of characteristics most relevant to our users. The Census Bureau’s 5-year estimates provide a much larger sample, allowing more precise estimates for areas with smaller populations (less than 65,000 persons). The limitations of 5-year estimates are for measures that may vary significantly over time, such as employment rates, because we are essentially averaging employment rates over a 5-year period.
Beyond the 1- and 5-year data differences there are other differences. According to the Census Bureau, “custom” estimates based on the ACS Public Use Microdata Sample (PUMS) file are expected to differ slightly from the Census Bureau’s ACS estimates even for the same year.
Minor discrepancies may be due to one or more of the following reasons:
More info: See Public Use Microdata Sample (PUMS) Accuracy of the Data (2023) (PDF).
The Census Bureau did not release its standard ACS 1-year Public Use Microdata Sample (PUMS) data in 2020 because the COVID-19 pandemic resulted in substantially lower response rates and a non-response bias that could affect the accuracy of estimates. The 2020 ACS 1-year estimates did not meet the Census Bureau’s Statistical Data Quality Standards designed to ensure the utility, objectivity, and integrity of the statistical information.
For more information, see Census Bureau Announces Changes for 2020 American Community Survey 1-Year Estimates. Below are a few pertinent excerpts from this document:
The COVID-19 pandemic posed numerous challenges to collecting ACS data in 2020, as described in our recent Adapting the American Community Survey Amid COVID-19 blog. As a result, the ACS collected only two-thirds of the responses it usually collects in a survey year and the people who did respond to the survey had significantly different social, economic and housing characteristics from those who did not. This is called “nonresponse bias.”
Specifically, Census Bureau staff found high nonresponse from people with lower income, lower educational attainment, and who were less likely to own their home. Nonresponse bias is a natural part of sample surveys, and often statisticians can adjust for nonresponse bias by giving more weight to responses from underrepresented groups. However, Census Bureau staff found that standard nonresponse adjustments to the ACS 1-year estimates could not fully address the differences in a way that meets Census Bureau quality standards.
Because of the underlying quality concerns, the Census Bureau urges caution in using the experimental estimates as a replacement for standard 2020 ACS 1-year estimates. Users should evaluate the estimates and alternatives to determine if they are suited for their needs. To create these estimates, the Census Bureau will apply an alternative set of weights to the 2020 ACS data to attempt to adjust for some of the nonresponse bias.
This website has two resources that provide information about disability data sources:
You can also access these resources from the Dataset Tools menu in this website’s top navigation.